


19. October 2023
author:
Sabrina Feuerherd |
Benedikt Liebig
Using visualization to create digital-ready legislation
Both the German federal government and the Federal Ministry of the Interior and Community (BMI), which is leading this initiative, have emphasized the particular importance of visualization as part of the approved key points for Digitalcheck (page in German). Visualization emerged as an important methodology for digital-ready regulations early on in the process of working on Digitalcheck. The National Regulatory Control Council (NKR) also views visualization as a key factor in digital readiness (page in German) and therefore emphasizes in its reviews the visualizations submitted by ministries. This post discusses how visualizations are already used as part of Digitalcheck – and where we believe there is further potential for this approach.
A visualization is a graphic representation that aids in understanding thoughts, relationships, or processes. There are many different methods and tools used to create visualizations, often building on standardized notations – that is, on a defined “language” with its own signs and symbols for different elements and how they relate to each other.
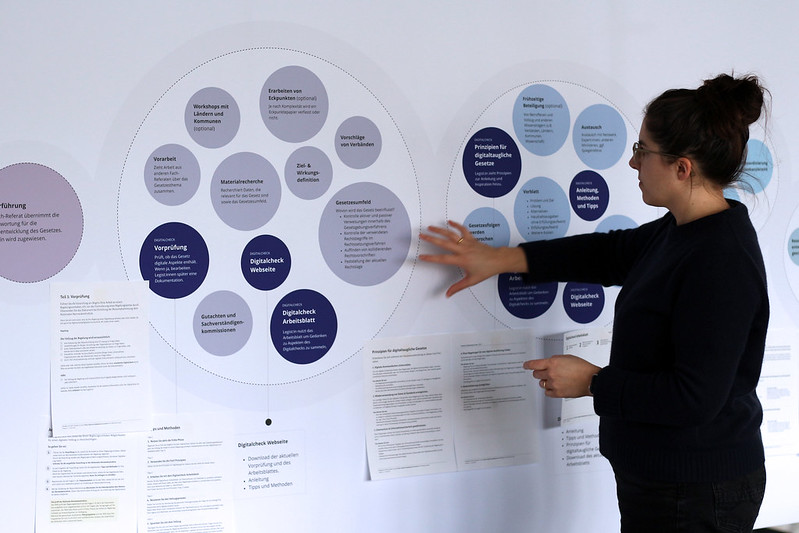
However, it is also possible to craft a visualization from scratch to add value. One visualization that we believe has been crucial to our understanding of the legislative process, and that we continue to use regularly, is the Digitalcheck service landscape.
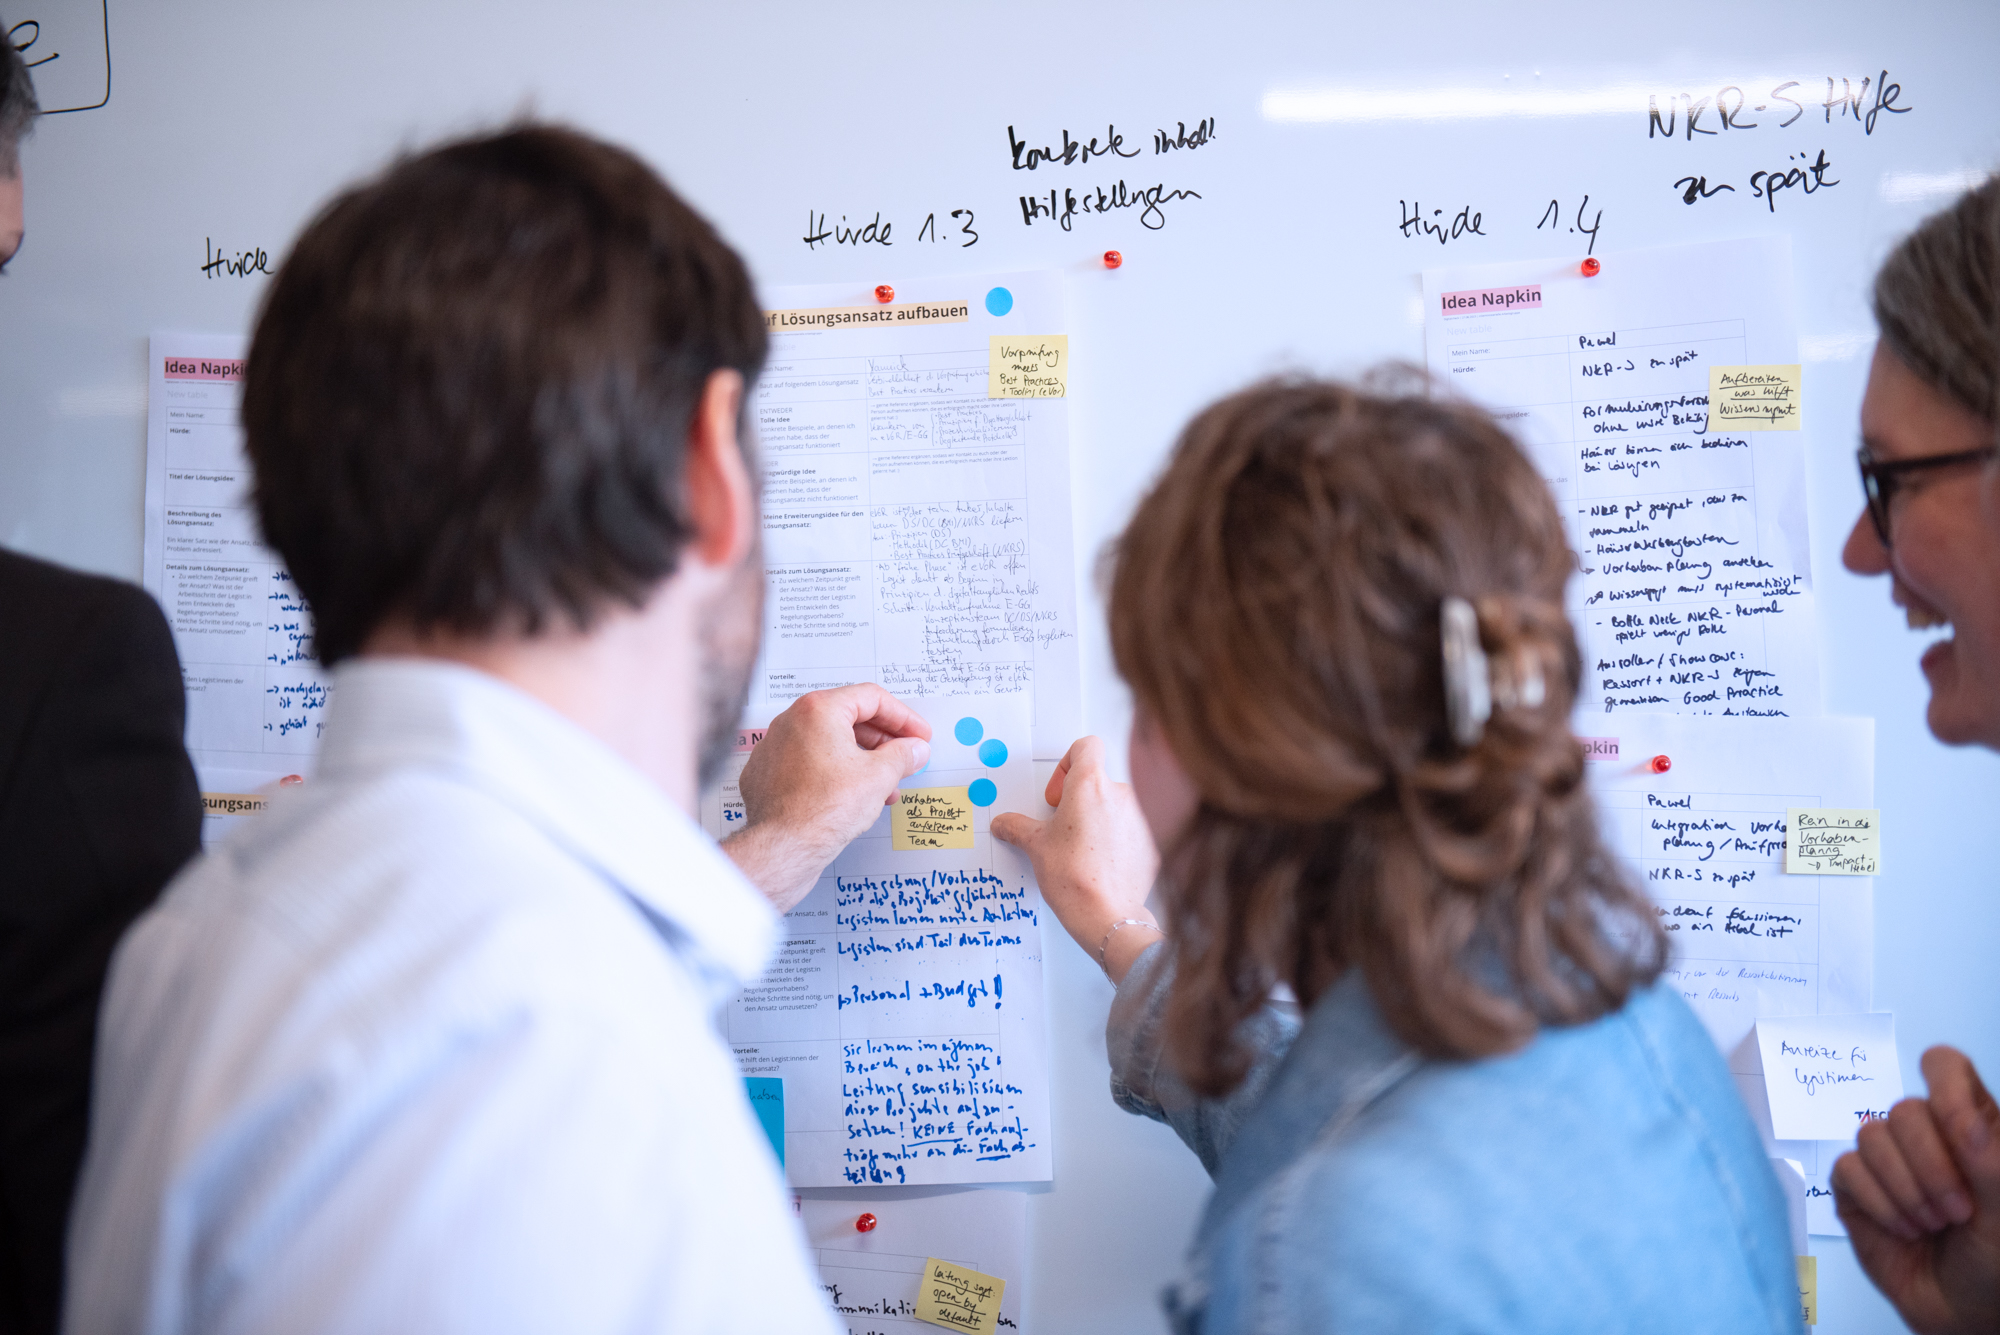
Ever since Digitalcheck was first introduced, in January 2023, we have recommended that policy drafters – the people who draft legislation within the federal ministries – visualize how their proposed laws are to be implemented.
But why should the people who write the texts of laws deal with visualizations in addition to legal and subject-specific matter?
Zooming in to identify obstacles
To ensure that regulations are digital-ready, they need to be considered from the standpoint of implementation. Visualization helps as an effective way to structure complex processes so they can be understood more quickly and intuitively.
When creating a visualization, policy drafters zoom in on which procedures and decisions are needed at the various levels in order to implement a particular piece of legislation. This can be a very broad field, extending from the federal and state levels down to municipal administrations – and beyond to companies and communities, which are ultimately the target groups for laws. This shines a light on potential obstacles to digital implementation that could easily be overlooked from a bird’s-eye view. A visualization offers an overview of the entire process, including all work steps, target groups, and stakeholders and their needs and requirements. Decision-making chains and dependencies also become visible: for instance which existing data and infrastructure elements can be used in the course of implementation.
The process of creating the visualization itself yields initial insights, as policy drafters explore the digital options along with emerging solutions. For example, visualization highlights any logical inconsistencies in decision-making structures that might stand in the way of automation. Gaining an overview of all the stakeholders involved can also act as an incentive to investigate which data is already available elsewhere, so there is no need to collect it all over again. Unnecessary feedback loops, discrepancies, and open-ended procedures also become apparent as a result of this deeper consideration of implementation. As do switches between media, where either data needs to be shifted to a different format or users need to change between media while completing a transaction.
This means working with visualizations is a huge help to policy drafting personnel in applying as many of the five principles for digital-ready legislation as possible to their legislative drafts.
Visualization can also help solidify and organize drafters’ own thoughts, so they can be communicated to others involved in the process of crafting and deciding on legislation.

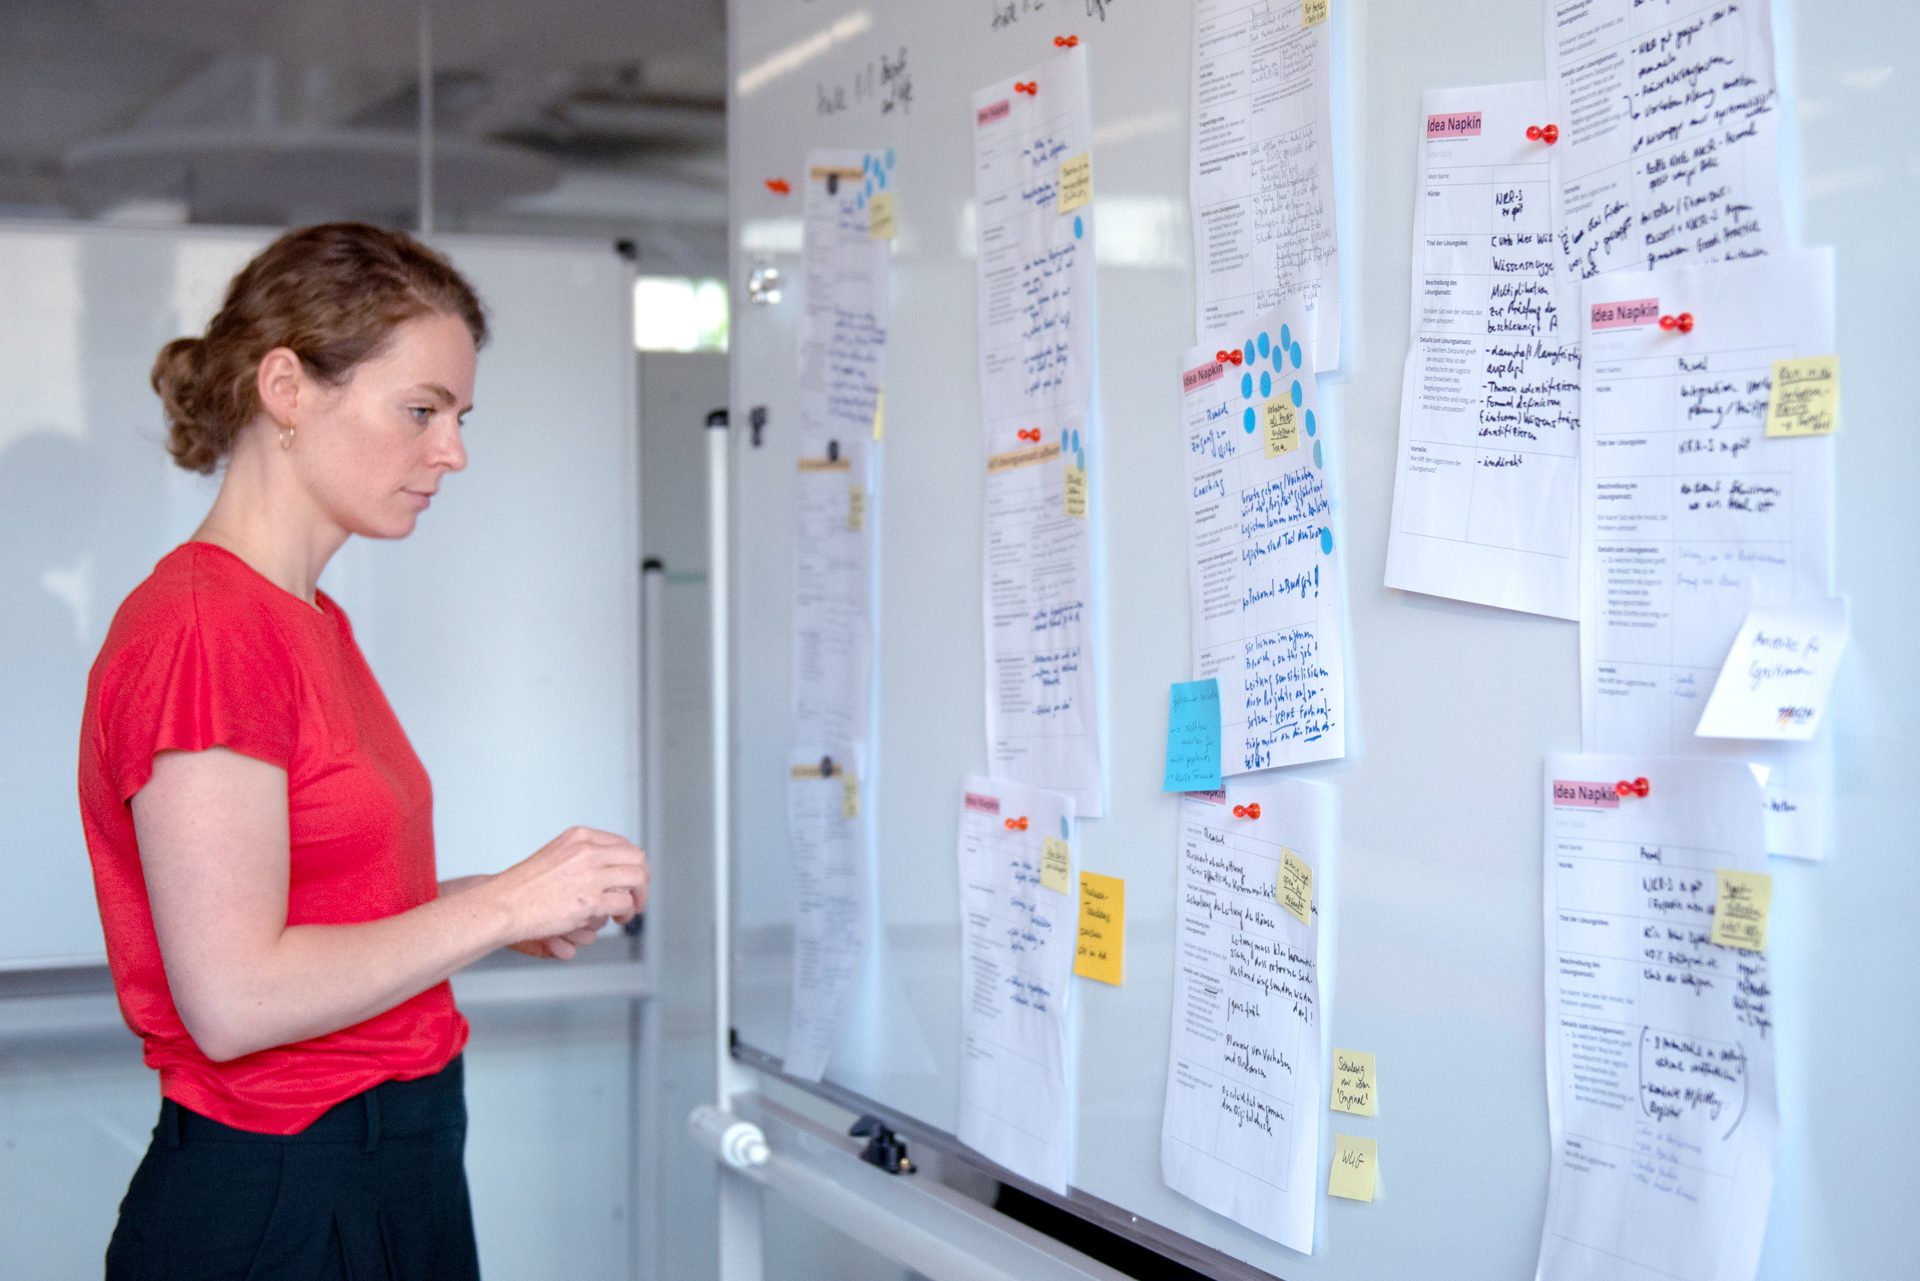
Visualization has been a part of Digitalcheck from the start
When we started working on Digitalcheck, we assumed that simple visualizations on paper would be enough to think through and understand the implementation of legislation. We recommended that very method in version 1.1, which came out in January 2023, and tested it repeatedly afterward.
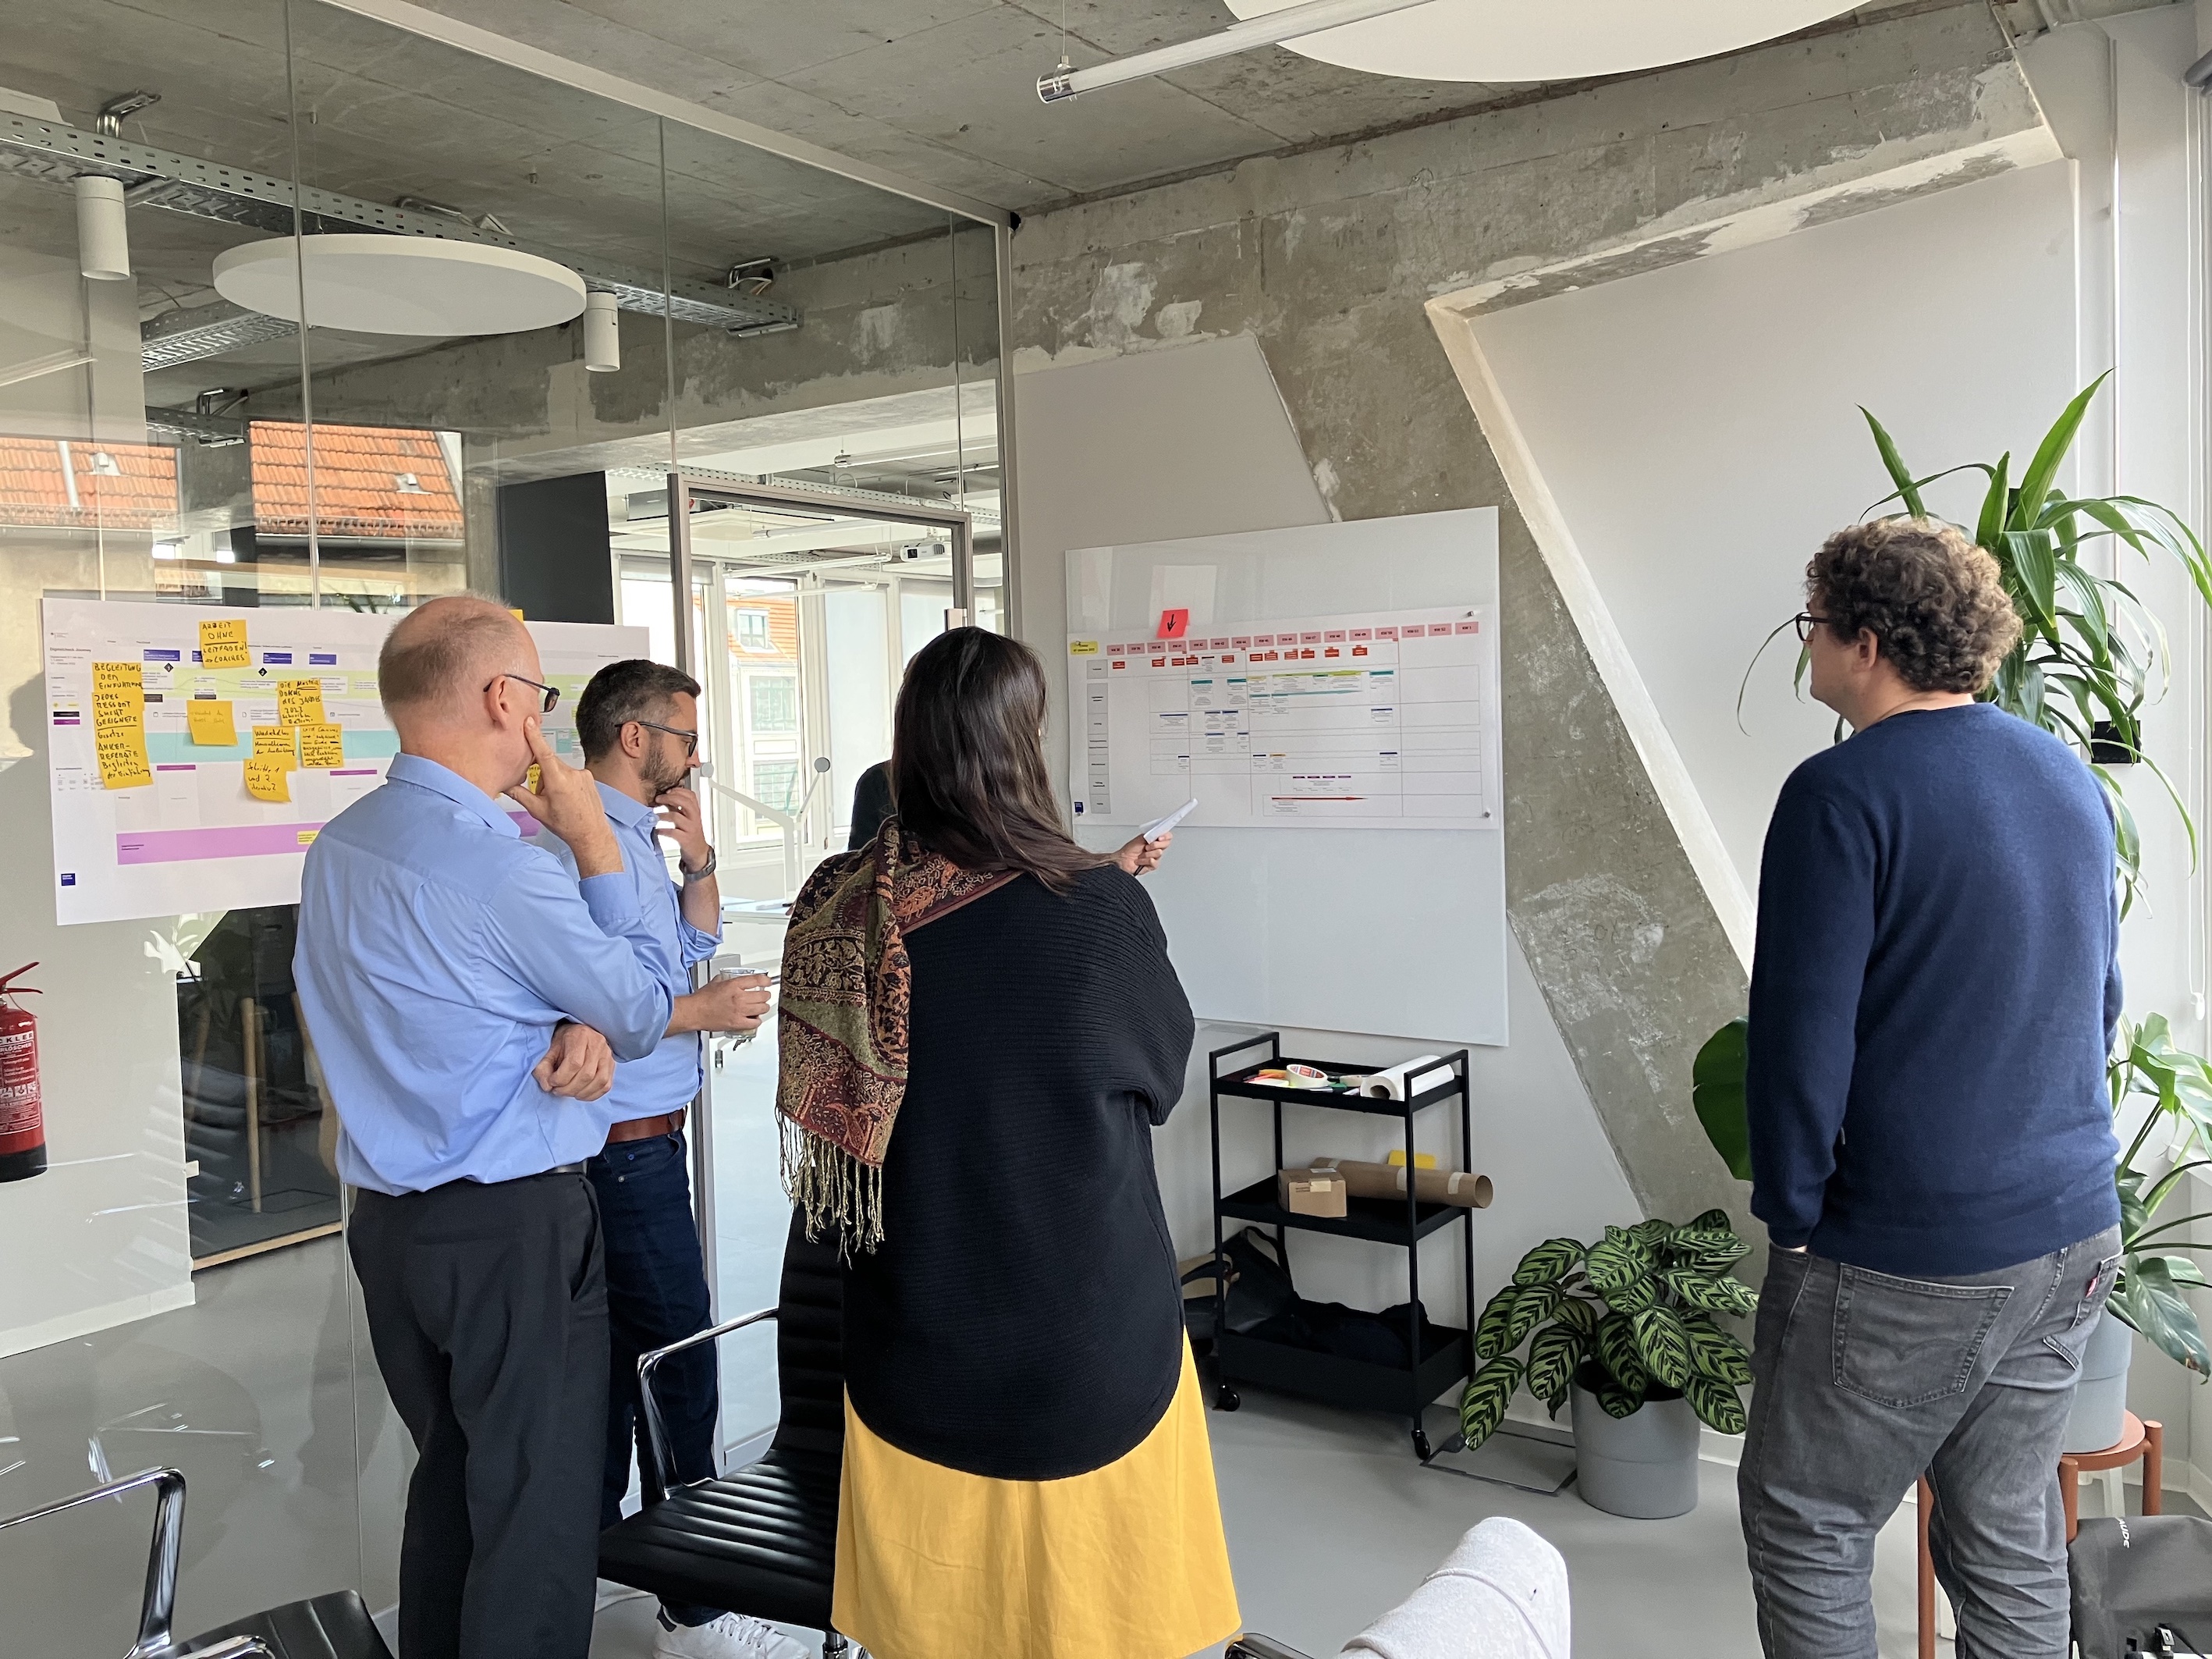
This simple form of visualization is very helpful, especially during the early phase. However, it soon became clear that having a shared understanding within a single department would not be enough. Visualizations needed to work across institutional lines and at different stages of the legislative process. While providing Digitalcheck support, for example, we learned that visualizations used for dialogue with the stakeholders in charge of implementation could open doors to a better understanding of the new law, helping with the process of assessing feasibility. The NKR Secretariat can also refer to visualizations in its reviews and assessments.
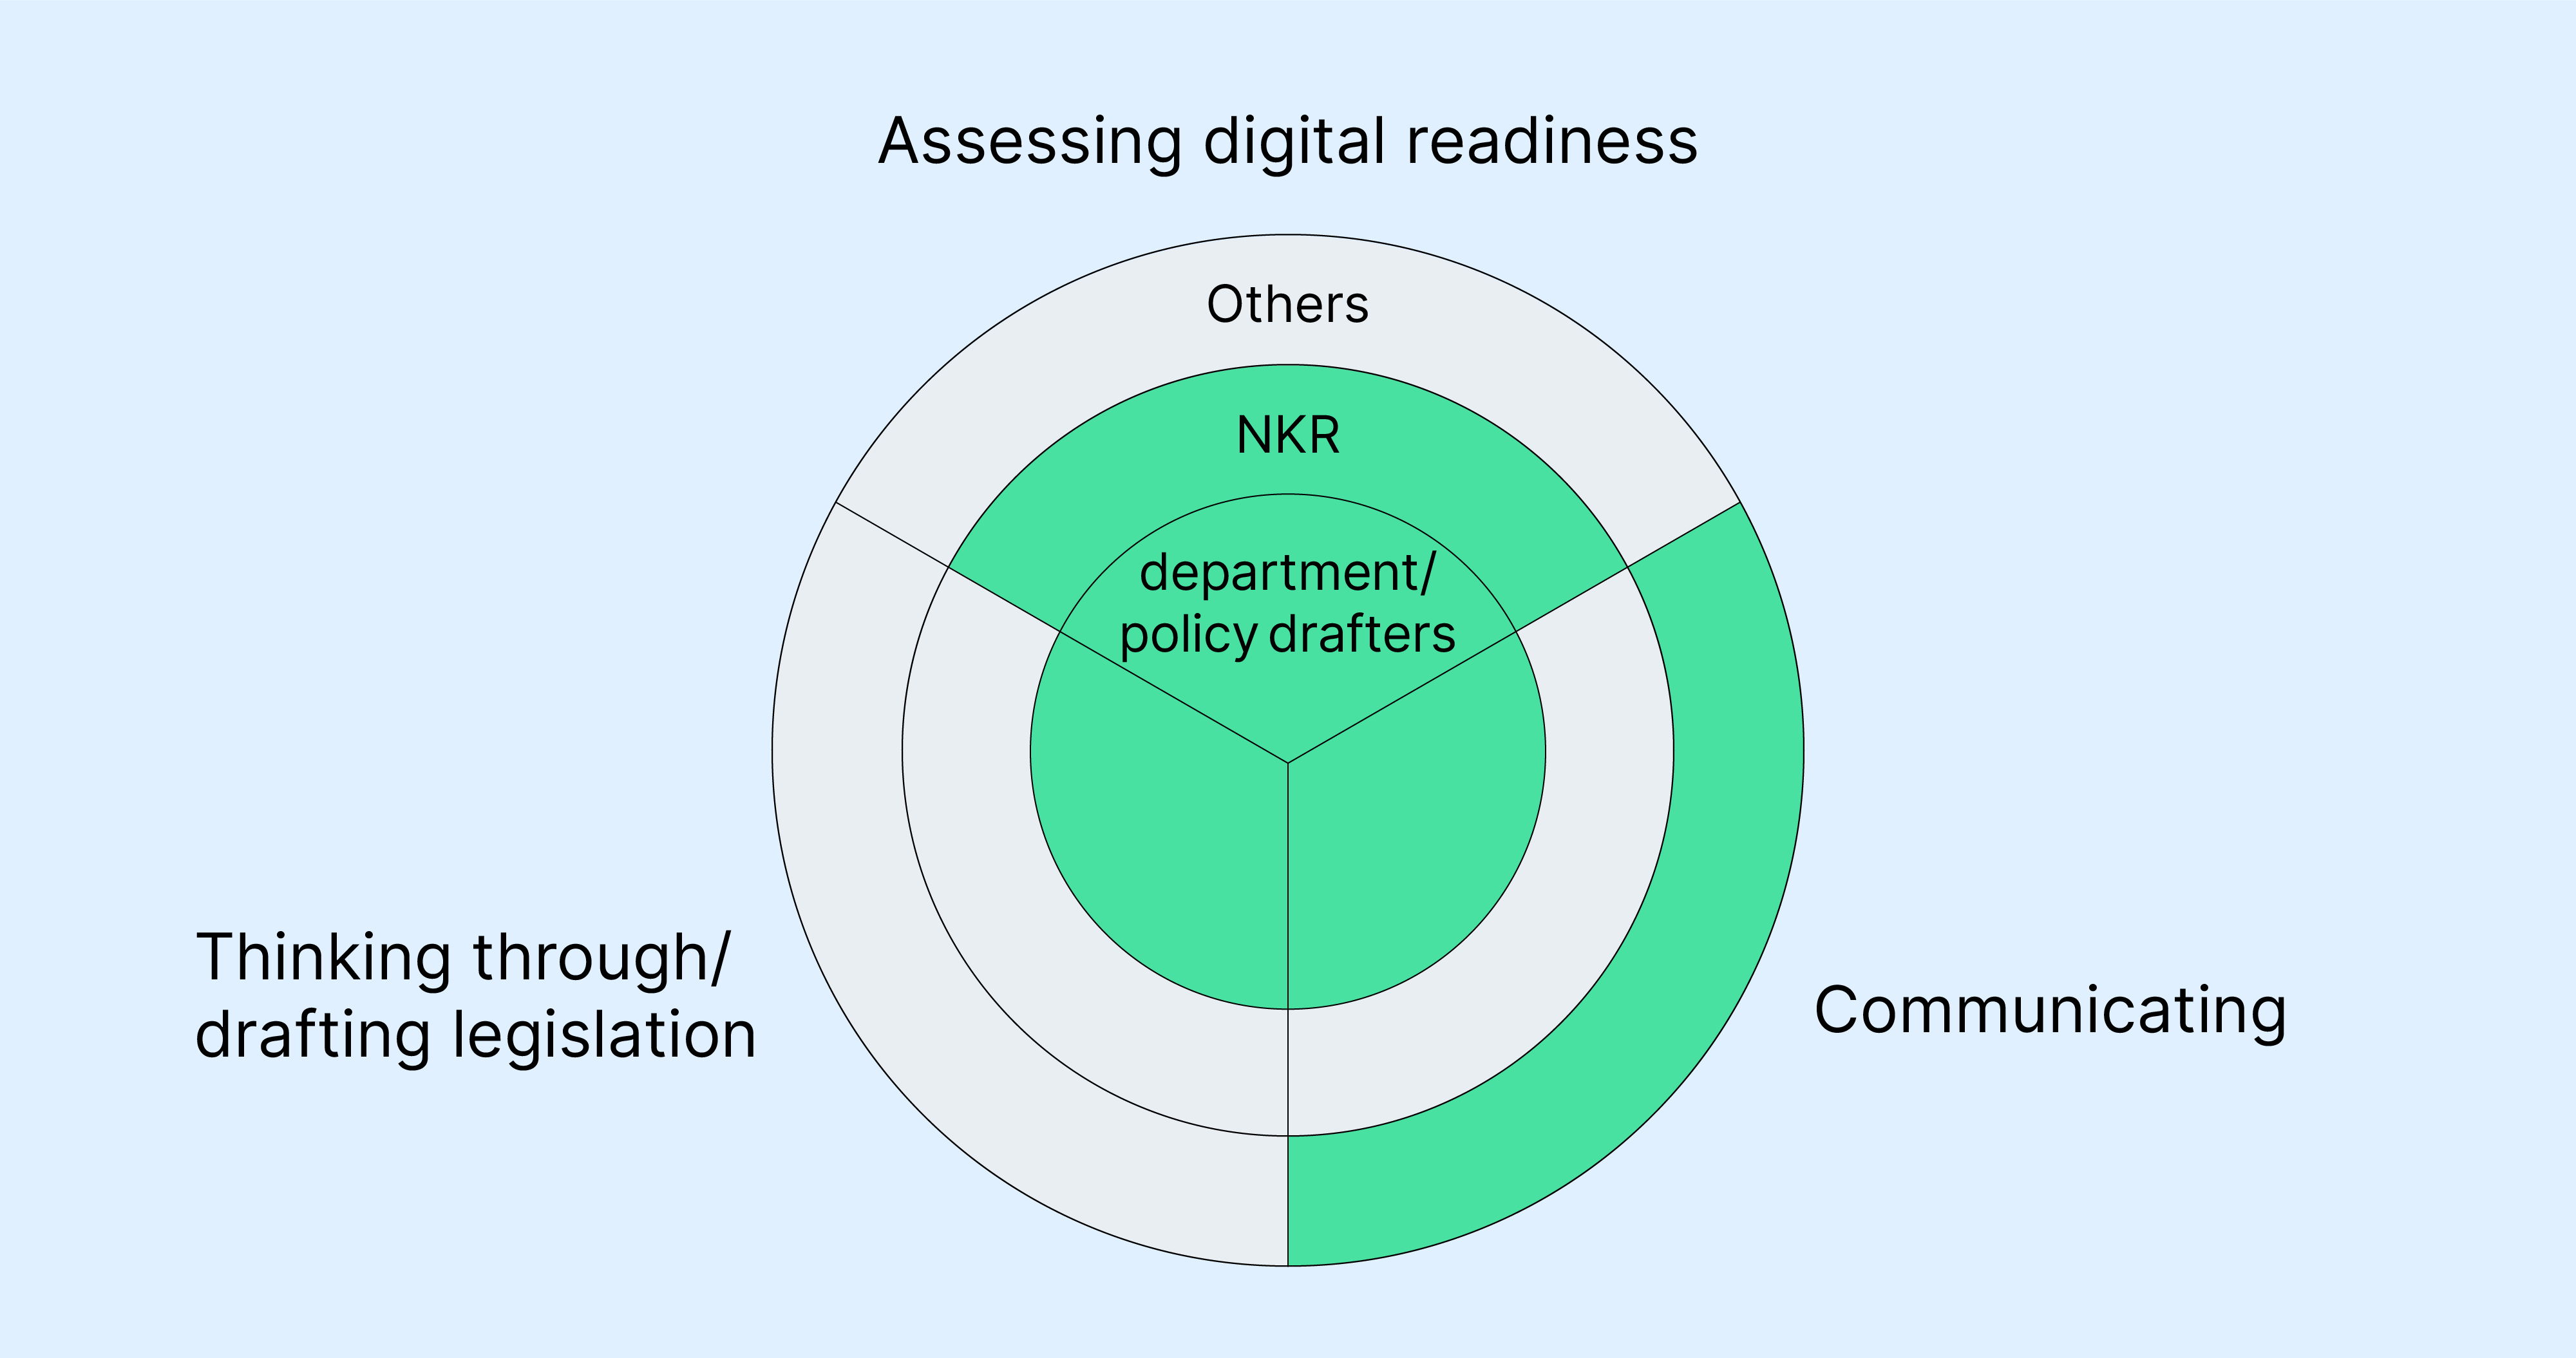
Visualizations help stakeholders at all the different stages of the legislative drafting process, from thinking through the law to exchanging views with others and the review by the NKR.
After further tests and discussions, we introduced a simple flow chart notation in version 1.2 in June 2023. We expect this streamlined form of visualization will be a good shared basis for depicting implementation processes in a form that is readily understood.

The current version, Digitalcheck 1.2, explains key elements of flow charts that are helpful when visualizing proposed legislation.
Step-by-step advancement of visualization tools for digital-ready legislation
Currently, we are exploring just how detailed visualizations should be and what specific tools and software are best suited to this purpose. Simultaneously w ealso need to find out and take into account which programs are already available or at least accessible across different institutions.
It is clear to us that the flow chart guidance provided in version 1.2 is only the start of broad-based, effective use of visualization in the legislative process. Beyond investigating which tools and options are right for policy drafters, we are also focusing on how visualization can be used throughout the entire legislative cycle, as well as determining the purposes and target groups for which visualization is helpful and important in this context.
The NKR Secretariat has reported to us that they are receiving more and more visualizations together with the Digitalcheck documentation. We are, of course, working continuously with the NKR to assess how effectively these visualizations are executed and applied. But on the whole this is a highly positive sign – along with the fact that the NKR itself recently used a visualization for the first time in one of its own statements, on the draft law amending marital and birth surname regulations.
This makes visualization a high priority for us as part of Digitalcheck, especially the following four areas of focus:
Raising awareness of visualization and when it should be used
Providing information on how visualization can be used in which cases
Providing training on how visualization works and contributes to digital readiness
Identifying the methods used for visualization and how visualizations can be integrated into the work structure
Our experience has shown that visualization can be especially helpful in ensuring digital-ready legislation, shortening and streamlining the journey from new laws to good digital services. With this in mind, we will be further developing the Digitalcheck tools and services in the months to come with an eye to providing ever better support to policy drafters in visualizing new laws at an early stage and ensuring their digital readiness.
Any questions or comments about the subject of this post or Digitalcheck in general? Feel free to e-mail us at digitalcheck@digitalservice.bund.de. We’re happy to hear from you!
For further information on how Digitalcheck came about and the content of Digitalcheck, please see our previous blog posts, “Bridging the data gap: How we are advancing Digitalcheck – driven by data,” “Digitalcheck: Refining the beta version step by step,” and “Establishing the foundations for a digital state through digital-ready legislation.”
Sabrina Feuerherd
works as a Service Designer at DigitalService to design better administrative services for everyone. Through a broad set of design methods, she brings order and structure to complex issues. In her free time, Sabrina enjoys strolling through bookstores and, as the former founder of Berlin's only Zero Waste meetup, pays attention to sustainable living.
Benedikt Liebig
is a Senior Product Manager and Project Lead at DigitalService. He was a fellow of the 2020 Tech4Germany cohort. Since then, he has been supporting digital projects of the federal public administration – with an iterative, data-driven, and human-centric view. He creates spaces in which administration, design, IT, and law work as a team in an interdisciplinary and fun way to provide a service. In his personal life, Bene is often on the road with his racing bike and is committed to a climate-resistant forest.
Read more on the topic